News
Winter weather helps market stabilize after holidays

This week’s FreightWaves Supply Chain Pricing Power Index: 40 (Shippers)
Last week’s FreightWaves Supply Chain Pricing Power Index: 40 (Shippers)
Three-month FreightWaves Supply Chain Pricing Power Index Outlook: 40 (Shippers)
The FreightWaves Supply Chain Pricing Power Index uses the analytics and data in FreightWaves SONAR to analyze the market and estimate the negotiating power for rates between shippers and carriers.
This week’s Pricing Power Index is based on the following indicators:
Volumes suffer sluggish start to 2025
Coming out of the holidays, it has taken some time to erase the noise associated with Christmas and New Year’s. Tender volumes have recovered from the holiday, but 2025 is off to a sluggish start. A slow start to the year isn’t unusual as January and February are traditionally the softest period of the year for freight.
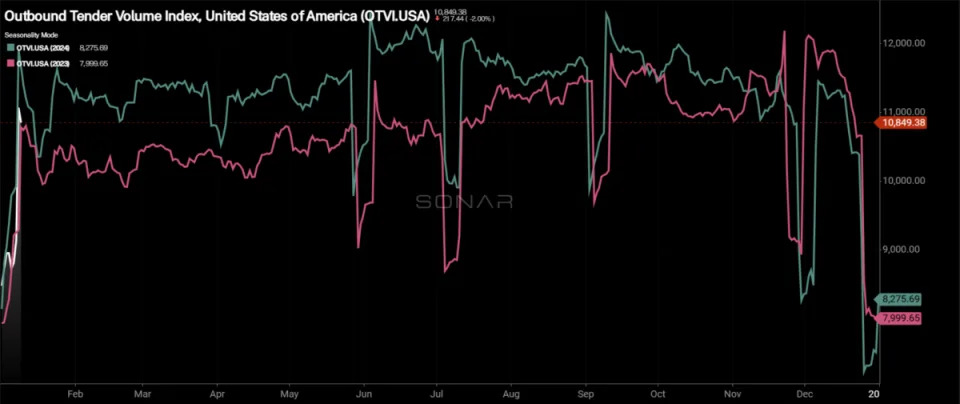
The Outbound Tender Volume Index (OTVI), a measure of national freight demand that tracks shippers’ requests for trucking capacity, continued to recover, rising 24% over the past week, but that increase is solely based on soft comps. Compared to this time last month, the OTVI is down 3.74%, which signals the weakness that demand is facing to start the year. Compared to the same time last year, tender volumes are down 3.2%.
With a strike at the East and Gulf Coast ports averted with the agreement that pushes the potential for another strike out six years, pending ratification by the International Longshoremen Association’s rank and file, it will be interesting to see if the East Coast ports are able to recapture any volume that was shifted to the West Coast.
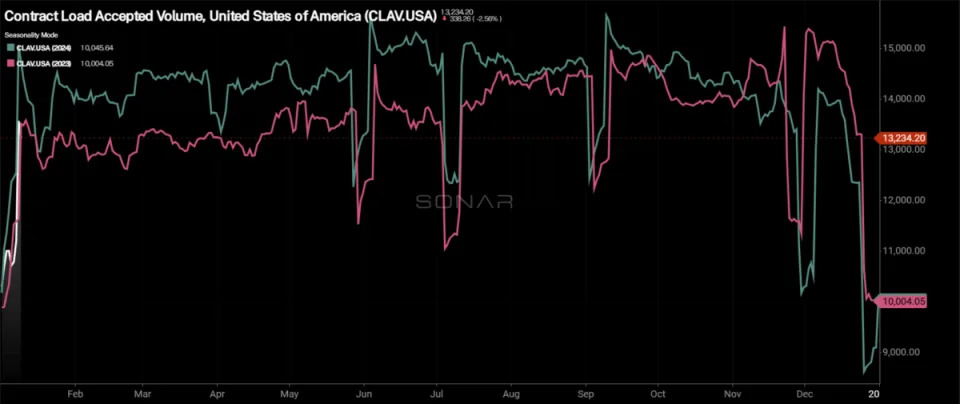
Contract Load Accepted Volume (CLAV) is an index that measures accepted load volumes moving under contracted agreements. In short, it is similar to OTVI but without the rejected tenders. Looking at accepted tender volumes, the increase is slightly smaller than the OTVI, due to an increase in tender rejection rates, rising 23.7% week over week. CLAV is still down 6.6% y/y.
Bank of America’s most recent card spending report showed that credit and debit card spending per household was up 0.7% month over month and 2.2% y/y. This week’s retail sales report will likely show continued growth in spending, though areas that were strengths in November will suffer some pullback in December, due to seasonal adjustments surrounding Black Friday through Cyber Monday.
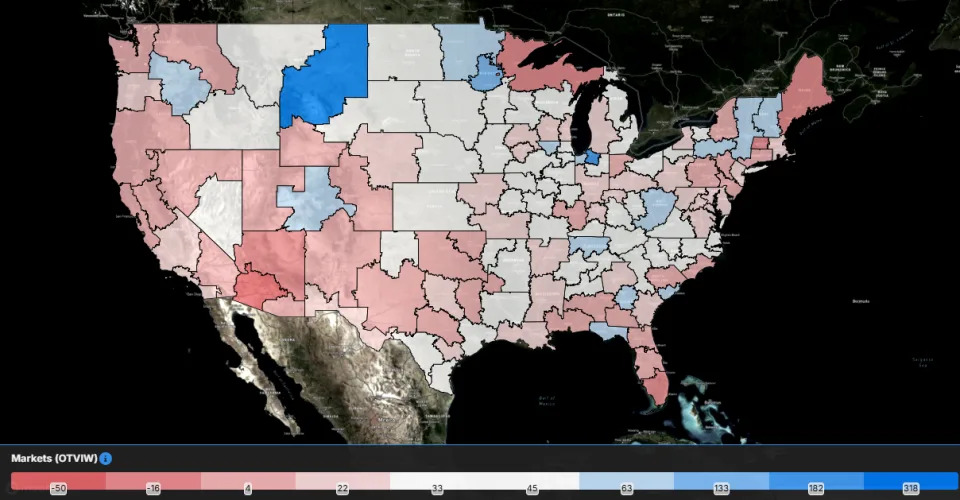
As the market recovers from the holiday season, the vast majority of the freight markets have seen growth in tender volumes over the past week. Of the 135 markets tracked within SONAR, 130 reported higher volumes over the past week.
The largest increases in the country this week stemmed from some of the smallest freight markets, thus not impactful to the overall freight market. Next week’s report will create a clearer picture of how volumes across the 135 freight markets are actually faring as opposed to making comparisons to data that is still impacted by the holidays.
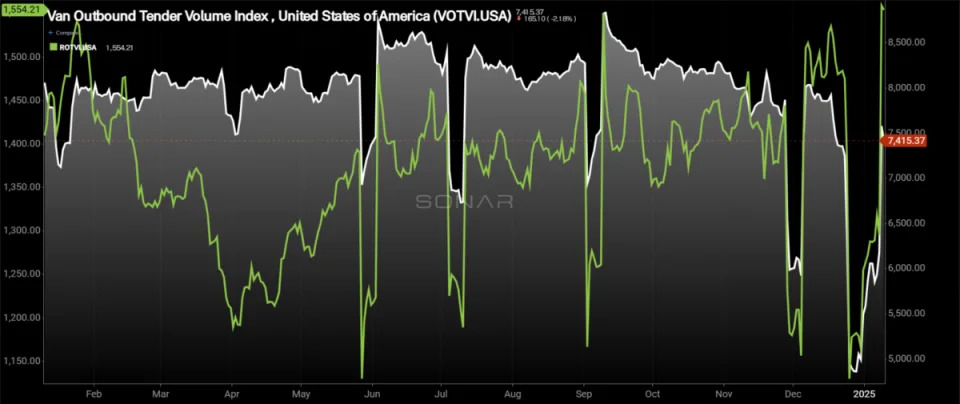
By mode: The dry van market faces continued headwinds in 2025 as van volumes are well below where they were this time last year. The Van Outbound Tender Volume Index increased by 26.41% over the past week against holiday comps but is down 6.44% month over month. Compared to this time last year, dry van volumes are down 6.2% y/y.
On the flip side, the reefer market remains extremely resilient, and winter weather will likely sustain that resiliency in the short term. The Reefer Outbound Tender Volume Index increased by 22.2% over the past week and is up 3.27% compared to this time last month. Reefer volumes are up over 9% compared to this time last year.
Tender rejection rates rebound, breaking seasonal softening trends
After capacity returned to the roads following the holidays, tender rejection rates have actually increased over the past week. Two substantial winter storms along with devastating fires in Los Angeles show that the market is becoming increasingly unstable from the capacity side of the equation.
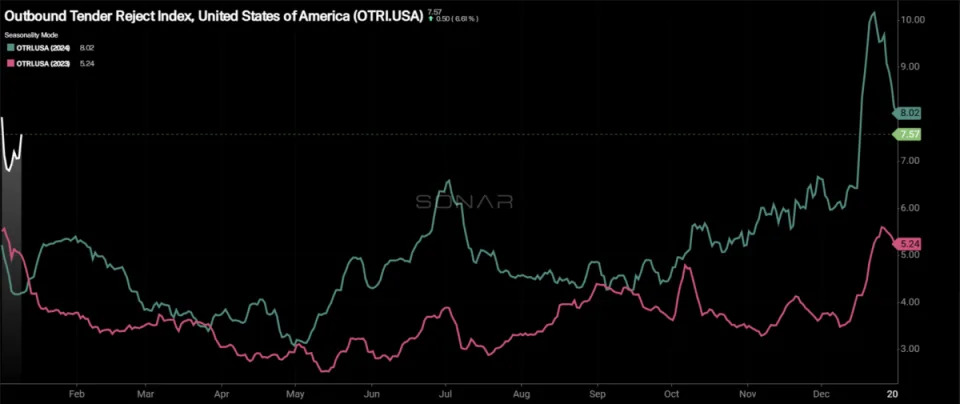
Over the past week, the Outbound Tender Reject Index (OTRI) was back on the rise, increasing by 44 basis points w/w to 7.57%. While tender rejection rates are off the recent highs, the increase this week is a positive sign for a market that shows all the signs that it is in transition to a tighter state. Compared to this time last year, tender rejection rates are up 336 bps.
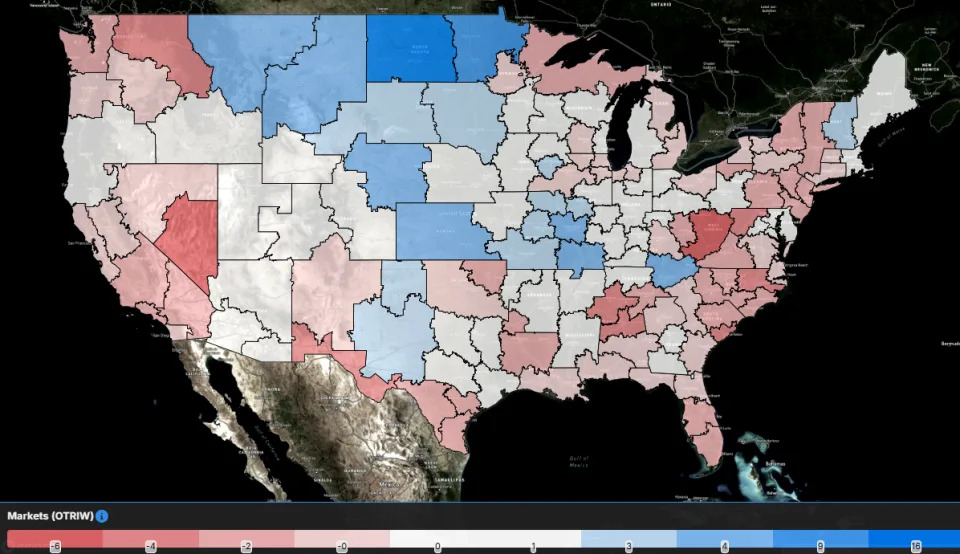
The map above shows the Outbound Tender Reject Index — Weekly Change for the 135 markets across the country. Markets shaded in blue are those where tender rejection rates have increased over the past week, whereas those in red and white have seen rejection rates decline. The bolder the color, the more significant the change.
Of the 135 markets, 77 reported higher rejection rates over the past week, up from the 22 that saw tender rejection rates rise in last week’s report.
Markets impacted by the winter weather on Thursday and Friday are among those that have experienced some of the larger increases over the past week. Rejection rates in Nashville and Memphis, Tennessee, increased by 190 bps and 230 bps, respectively. Further west in Little Rock, Arkansas, tender rejection rates increased by 264 bps.
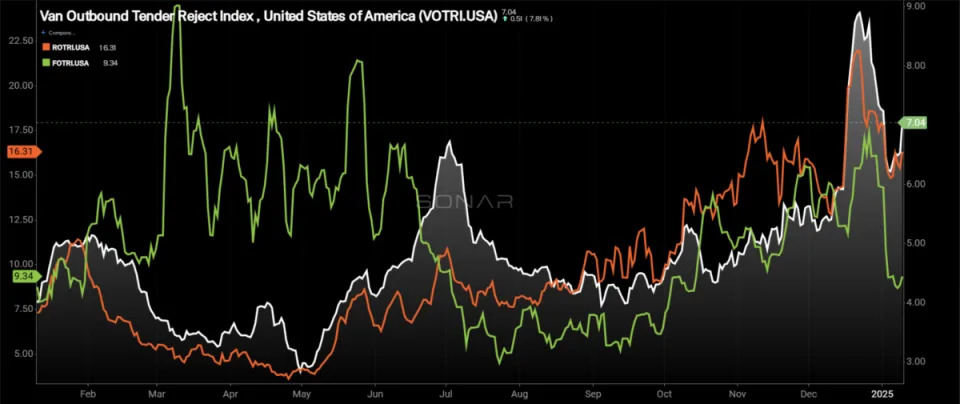
By mode: Even as tender volumes suffer, the capacity side of the dry van market is tightening. The Van Outbound Tender Reject Index increased by 58 bps over the past week to 7.04%. Dry van rejection rates are 297 bps higher than they were this time last year.
The reefer market remains the tightest of the equipment types with tender rejection rates in the midteens. The Reefer Outbound Tender Reject Index increased by 47 bps over the past week to 16.31%, up 895 bps from this time last year. Severe winter weather across the country, specifically severe cold, could create an even tighter environment if increased protect-from-freeze measures are put in place.
The flatbed market continues to be the laggard, which is interesting given it is the smallest percentage of the three equipment types. The Flatbed Outbound Tender Reject Index fell by 650 basis points over the past week to 9.34%, up just 198 bps compared to this time last year. The flatbed sector could face more headwinds in 2025 as it appears that the Federal Open Market Committee will be less aggressive in rate cuts than previously forecast.
Spot rates remain elevated
With tender rejection rates increasing over the past week, carriers have been able to keep spot rates stable at elevated levels compared to where they were for much of 2024. As capacity continues to bleed out of the market, any demand-side shock to the market will create increased upward pressure on spot rates.
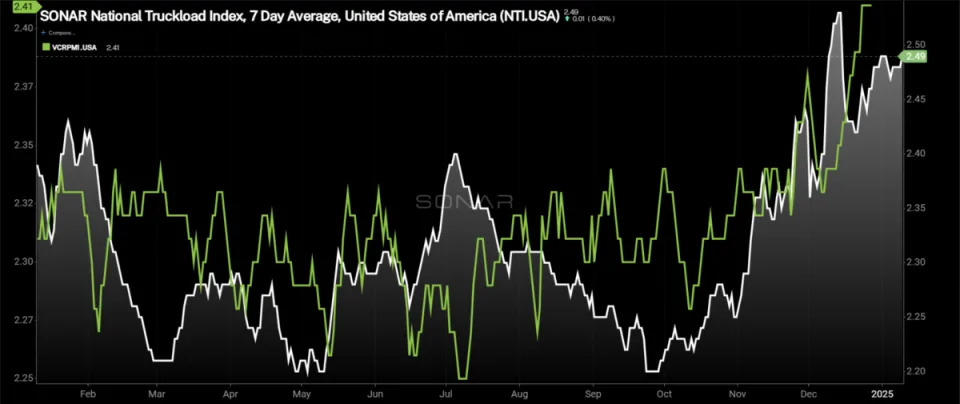
The National Truckload Index – which includes fuel surcharge and various accessorials – was unchanged over the past week at $2.49. The NTI is 11 cents per mile higher than it was this time last year. The linehaul variant of the NTI (NTIL) – which excludes fuel surcharges and other accessorials – increased by 1 cent per mile over the past week to $1.95. The NTIL is 18 cents per mile higher, widening the gap with last year’s levels significantly over the past week as spot rates have been resilient through the first full week of the new year.
Initially reported dry van contract rates, which exclude fuel, continued to rise as the data is now capturing the increases associated with the holidays. Rates are up 3 cents per mile over the past week to $2.41. Compared to this time last year, the van contract rate is flat, which again is a positive sign for carriers that the deflationary pressure to rates is in the rearview mirror.
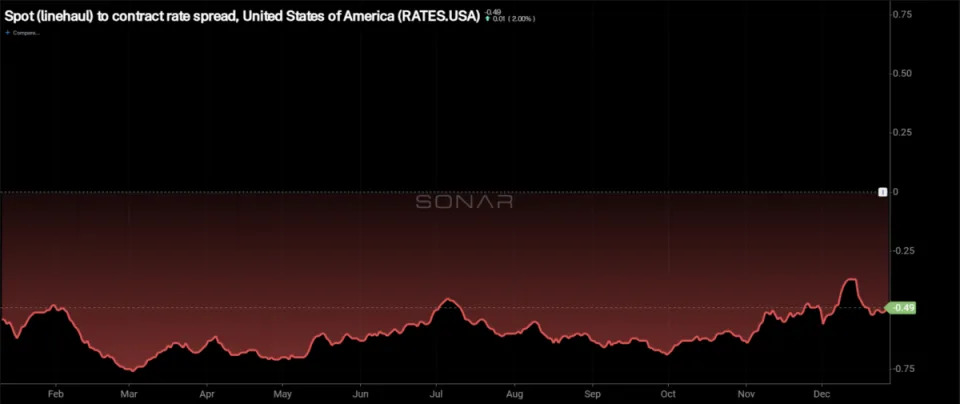
The chart above shows the spread between the NTIL and dry van contract rates is trending back to pre-pandemic levels. The spread remains wide, but with the recent moves in both spot and contract rates, it moved slightly wider than it was a week ago. Over the past week, the spread widened by 1 cent to minus 50 cents. Compared to this time last year, the spread is 19 cents per mile narrower than it was, another sign that the market is moving to a more carrier-friendly environment.
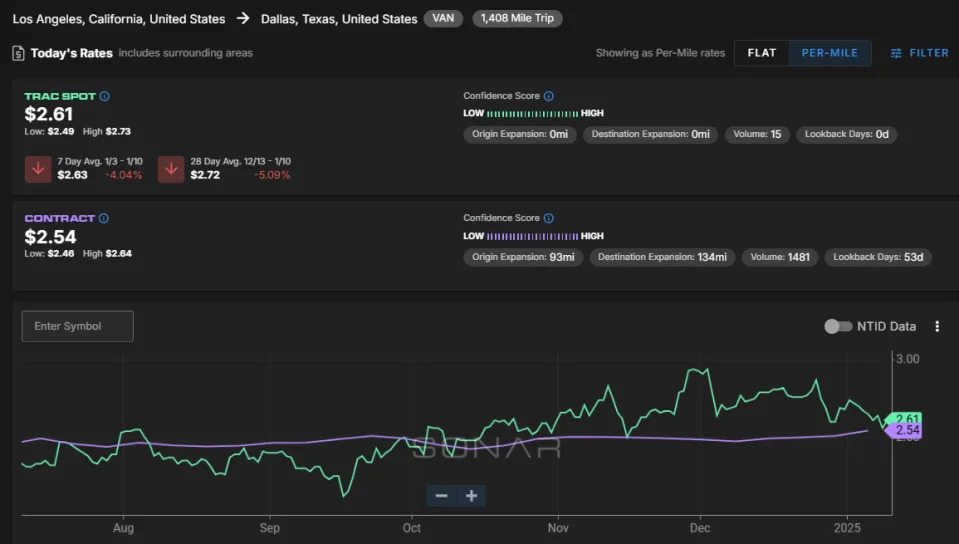
The SONAR Trusted Rate Assessment Consortium spot rate from Los Angeles to Dallas suffered a fairly large slide over the past week but remained above contract rates. The TRAC rate from Los Angeles to Dallas decreased by 11 cents per mile to $2.61. Spot rates along this lane are 7 cents per mile above the contract at present. The decline in spot rates comes as tender rejection rates fall dramatically, likely a sign of carriers trying to get any equipment in the region out amid the ongoing fires.
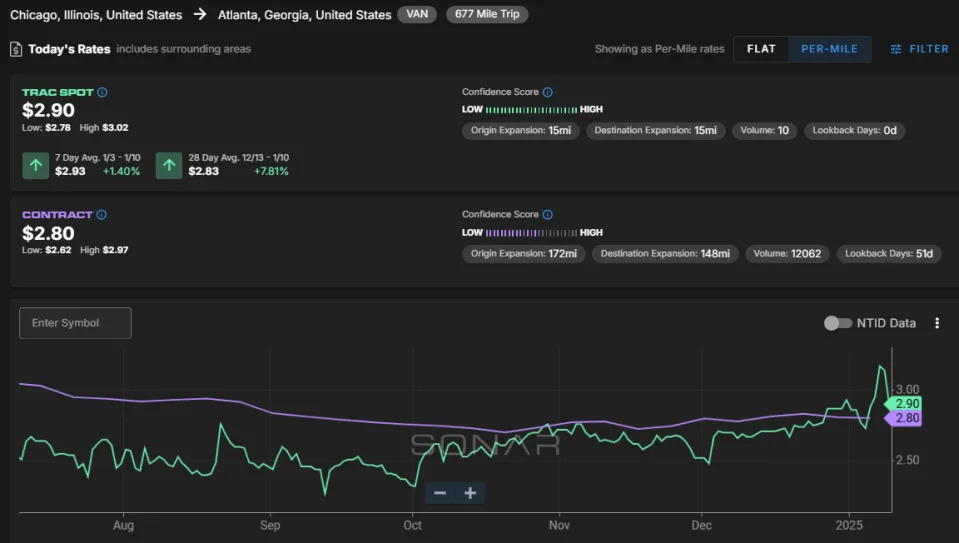
From Chicago to Atlanta, spot rates have been volatile, finally moving above contract rates and to the highest level in the past six months. The TRAC rate for this lane increased over the past week by 4 cents per mile to $2.90. Spot rates are now 10 cents per mile higher than contract rates, which could lead to tighter conditions along this lane.
The post Winter weather helps market stabilize after holidays appeared first on FreightWaves .

