News
13 dividend stocks selected for value at a time when the S&P 500 trades sky high
After an extended bull run, the S&P 500 as a whole is expensively priced based on valuation metrics. So the usual chorus of warnings that the stock market is overvalued is getting louder. This doesn’t mean you should avoid stocks, but it might serve you well to take a closer look at what makes the large-cap U.S. benchmark index appear to be so expensive. And if you are worried about your portfolio being highly concentrated in a few companies, various approaches can broaden your horizons.
Last week, analysts at Bank of America noted that U.S. stock indexes were at expensive levels “on almost any valuation metric.” But they also pointed out that companies dominating the current market have lower levels of debt than those with the highest valuations during previous expensive periods, and that the current dominators have also benefited from improved efficiency and productivity. So the analysts raised the alarm bell while also providing some comfort .
This aspect of the S&P 500 is critically important
The S&P 500 SPX is weighted by market capitalization, which is the market value of each listed stock, based on each component company’s most recently reported number of shares outstanding multiplied by the previous trading session’s closing share price. This cap-weighting means that a small number of dominant companies make up a large percentage of the index.
The largest three companies in the S&P 500 by market cap — Apple Inc. AAPL, Nvidia Corp. NVDA and Microsoft Corp. MSFT — make up 20% of the portfolio of the $611 billion SPDR S&P 500 ETF Trust SPY. This exchange-traded fund was established in 1993 and was the first ETF to track the index.
The S&P 500 returned 25% in 2024, following a return of 26.3% in 2023. All returns in this article include reinvested dividends. At this point, you may already have forgotten that the index fell 18.1% in 2022. It was no fun to wait out that market decline, but doing so was the best strategy for most long-term investors. Unless you are among the best market timers, moving to the sidelines to avoid the worst of a prolonged decline will likely hurt your long-term performance. Even if you sell early in the downward cycle, you will likely return after a recovery cycle has started. And if you are contributing to broad stock funds regularly as part of a company-sponsored retirement plan, you would have paid lower prices for contributions made during the period of weakness.
To put the last two years’ returns into perspective, the S&P 500’s average annual return over the past 10 years through Friday has been 13.2%, while the 20-year average has been 10.5% and the 30-year average has been 10.8%.
Getting back to the cap-weighting, you might be wondering how much the largest stocks in the S&P 500 contributed to the index’s return in 2024. One simple way to measure this is to weight the component stocks by their Dec. 31, 2023 market capitalizations and then apply the weightings to each stock’s total return for 2024. Then we can divide those weighted returns by the full index’s return.
Here are the 10 companies whose stocks contributed the most to the S&P 500’s total return in 2024:
|
Company |
Ticker |
Contribution to S&P 500 total return in 2024 |
Current forward P/E |
|
Nvidia Corp. |
NVDA |
20.9% |
30.5 |
|
Apple Inc. |
AAPL |
9.2% |
30.7 |
|
Amazon.com Inc. |
AMZN |
7.0% |
34.6 |
|
Broadcom Inc. |
AVGO |
5.8% |
34.1 |
|
Meta Platforms Inc Class A |
META |
5.2% |
23.9 |
|
Tesla Inc. |
TSLA |
4.9% |
121.3 |
|
Microsoft Corp. |
MSFT |
3.6% |
29.4 |
|
Walmart Inc. |
WMT |
3.1% |
33.3 |
|
Alphabet Inc. Class A |
GOOGL |
3.0% |
21.2 |
|
Alphabet Inc. Class C |
GOOG |
2.9% |
21.3 |
|
JPMorgan Chase & Co. |
JPM |
2.2% |
14.0 |
The list includes seven stocks, with two common share classes of Alphabet Inc. included in the index.
Is the S&P 500 really so expensive?
The above table includes forward price-to-earnings ratios for the listed companies. These are calculated by dividing the most recent closing prices for the stocks by consensus earnings-per-share estimates among analysts polled by FactSet for the next 12 months.
The forward P/E ratio is the most commonly cited valuation metric for a stock or stock index. This chart shows the S&P 500’s weighted forward P/E, based on rolling consensus 12-month EPS estimates, over the past 10 years through Monday’s close:
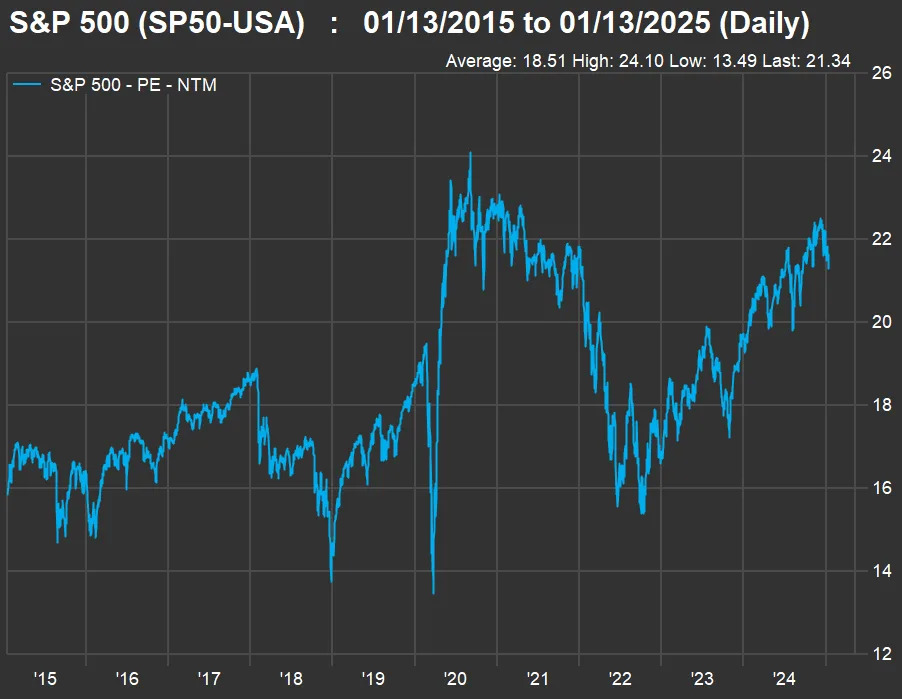
The index’s forward P/E is well above its 10-year average. Then again, John Buckingham, Jason R. Clark and Christopher Quigley wrote the following in the Prudent Speculator’s “2025 Visual Guide to the Markets” on Monday: “[W]e would never throw in the towel on stocks when the valuation metric is heavily dependent on just a handful of stocks.”
So what if the components of the S&P 500 were weighted equally?
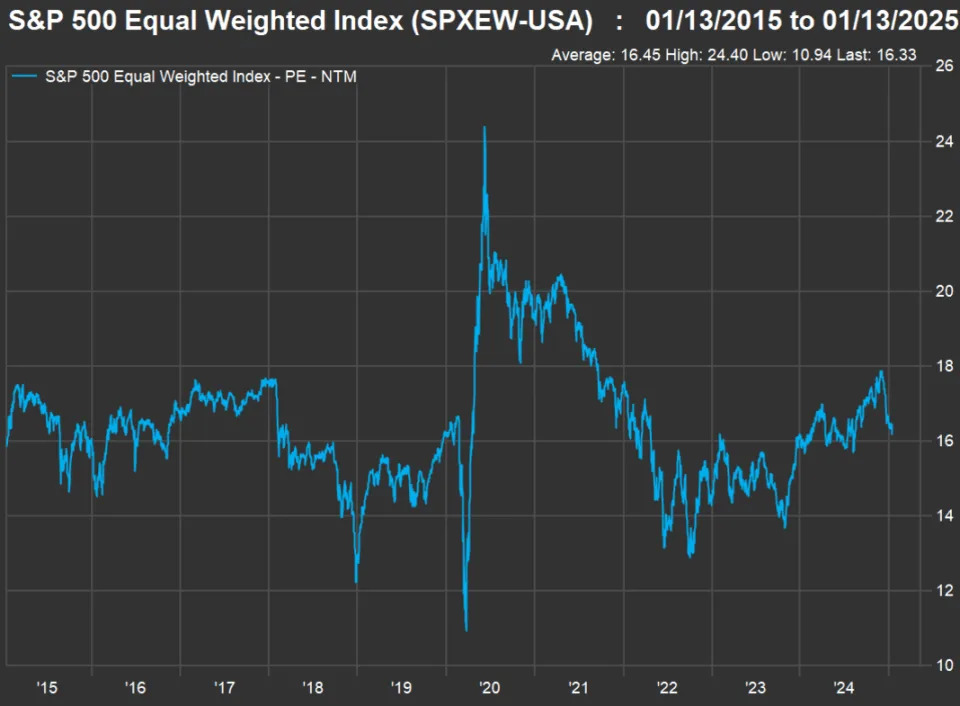
The above chart underlines the case that the cap-weighted S&P 500’s forward P/E might be overstating the case that stocks are expensive. The cap-weighted index rewards success.
The S&P 500 Equal Weighted Index is tracked by the Invesco S&P 500 Equal Weight ETF RSP. In October we looked at the performance for this and eight other Invesco exchange-traded funds that use various factors to select stocks within the S&P 500 .
A look at value
Stocks and indexes can be divided into growth and value camps, with the value names generally being mature companies that trade at lower P/E (or other valuations) than growth stocks, and often feature attractive dividend yields. So the broad stock indexes are divided into growth and value subsets.
The equal-weighted S&P 500 is more of a value index, based on its much lower P/E than that of the cap-weighted index.
Buckingham is a portfolio manager and the editor of the Prudent Speculator, which is published by Kovitz Investment Group of Chicago. Kovitz has over $27 billion in assets under management, focusing on value-oriented strategies for private and institutional clients.
Here is a comparison of returns for the cap-weighted S&P 500, the equal-weighted index, the S&P 500 Growth Index and the S&P 500 Value Index over the past 10 years:
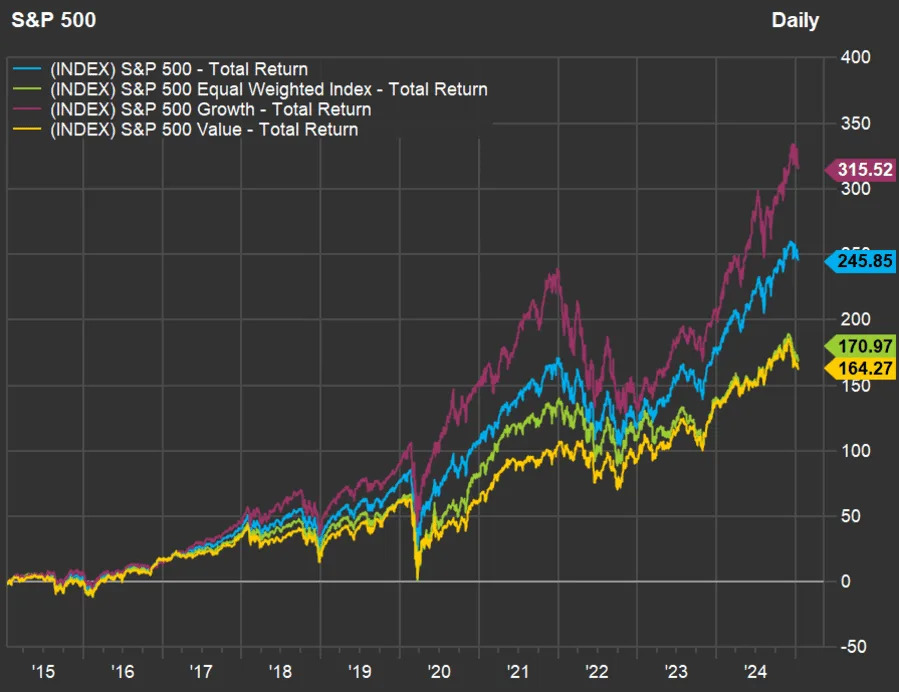
During an interview with MarketWatch, Buckingham said: “Value investors have nothing to apologize for. The returns have been fine. But they are not as good as they would have been if we had abandoned our principals and gone after hot stocks.”
The Prudent Speculator runs several portfolios for investors. Its core portfolio is made up of 80 value stocks. The Prudent Speculator team begins with a group of about 2,800 liquid stocks of companies listed in the U.S. (including secondary listings by non-U.S. companies), scoring them by a variety of metrics to identify those that trade at relatively inexpensive price multiples to sales, earnings, free cash flow, book value or by total enterprise value to operating earnings. Stocks are also screened using quality measures, such as debt-to-equity. Companies passing the screens undergo a more detailed qualitative review of business models, competition and for cyclical companies, and the wherewithal to withstand down cycles.
The Prudent Speculator has the second-highest ranking for 30-year performance through 2024 among investment letters tracked by the Hulbert Financial Digest .
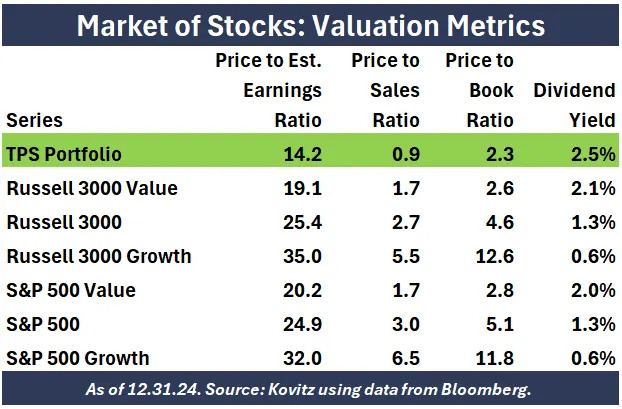
Buckingham shared this breakdown of valuations as of Dec. 31 for the core TPS portfolio and companies of the Russell 3000 Index RUA and the S&P 500, as well as those indexes’ value and growth subsets. The Russell 3000 Index is cap-weighted and designed to capture 98% of the U.S. market for publicly traded common stocks.
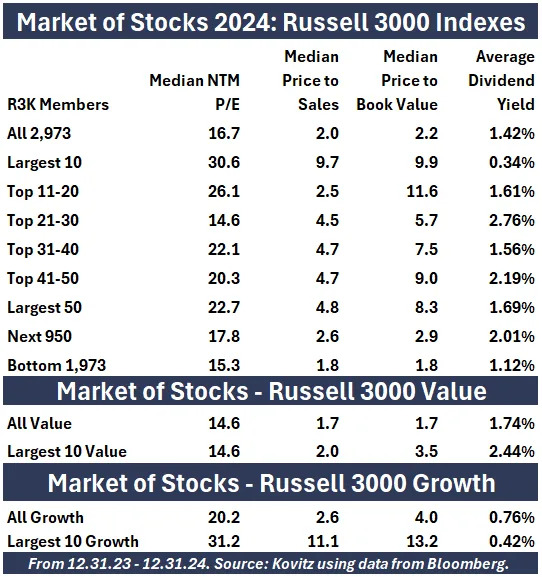
And here is Kovitz’s breakdown of median valuations and dividend yields for the Russell 3000 Indexes and their value and growth subsets:
13 value stocks selected from the core Prudent Speculator portfolio
Buckingham provided a “baker’s dozen” list of stocks as a sample from the main TPS portfolio of 80 stocks. These trade at low forward P/E valuations and have dividend yields that are at least twice that of the S&P 500, which has a weighted dividend yield of 1.29%, according to FactSet:
|
Company |
Ticker |
Sept. 13 price |
Prudent Speculator price target |
Dividend yield |
|
Bristol-Myers Squibb Co. |
BMY |
$55.36 |
$85.34 |
4.48% |
|
Civitas Resources Inc. |
CIVI |
$52.72 |
$94.14 |
3.79% |
|
Comcast Corp. Class A |
CMCSA |
$36.45 |
$62.16 |
3.40% |
|
CVS Health Corp. |
CVS |
$51.52 |
$84.73 |
5.16% |
|
ManpowerGroup Inc. |
MAN |
$56.28 |
$98.94 |
5.47% |
|
Mosaic Co. |
MOS |
$26.82 |
$41.06 |
3.28% |
|
Omnicom Group Inc |
OMC |
$83.16 |
$119.27 |
3.37% |
|
Bank OZK |
OZK |
$42.36 |
$66.85 |
3.97% |
|
Prudential Financial Inc. |
PRU |
$116.29 |
$145.13 |
4.47% |
|
Molson Coors Beverage Co. Class B |
TAP |
$53.81 |
$80.39 |
3.27% |
|
TotalEnergies SE ADR |
TTE |
$56.81 |
$91.71 |
4.91% |
|
Verizon Communications Inc. |
VZ |
$38.12 |
$56.12 |
7.11% |
|
Whirlpool Corp. |
WHR |
$120.67 |
$176.80 |
5.80% |
|
Sources: Kovitz, FactSet (for Sept. 13 prices and dividend yields) |
||||
Click the tickers for more about each company.
Read: Tomi Kilgore’s guide to the wealth of information available for free on the MarketWatch quote page
Don’t miss: These two bank stocks stand out for improvement in 2025

