News
Watch These Intuitive Surgical Price Levels as Stock Hits Another Record High

Key Takeaways
Intuitive Surgical ( ISRG ) shares hit another record high Thursday, one day after the medical technology company issued preliminary fourth-quarter and full-year revenue above expectations amid growing demand for its surgical robotics equipment.
The company placed 493 of its da Vinci surgical systems in the fourth quarter of last year, up from 415 in 2023. It also said that procedures using the equipment in the period grew 17% from the prior year, driven by use during cancer operations. The technology, which the company says has completed over 14 million procedures, assists surgeons' hand movements, helping to perform minimally invasive surgery.
Intuitive Surgical shares gained 0.7% to close at just above $584 on Thursday, after surging nearly 8% yesterday. Intuitive Surgical shares have risen 60% over the past 12 months, handily outpacing the S&P 500 's return of 25% during the period.
Below, we take a closer look at the technicals on Intuitive Surgical's chart and point out key price levels worth watching out for.
Extended Rising Wedge
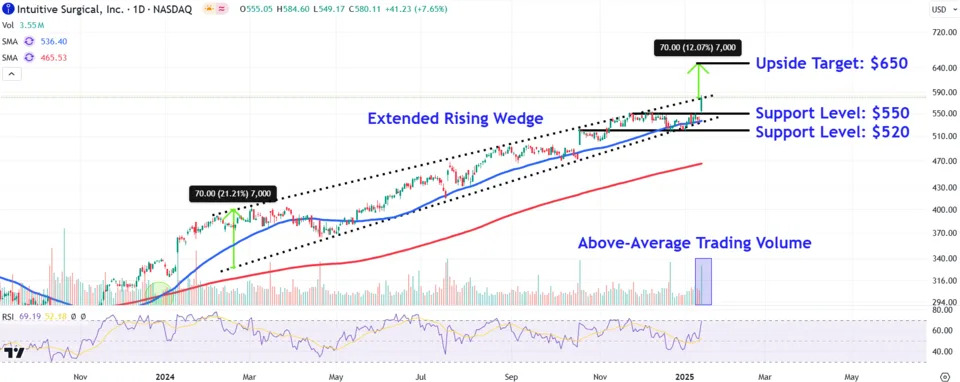
Intuitive Surgical shares have traded in an extended rising wedge since early February last year, keeping the price confined within the pattern’s two converging upward sloping trendlines.
More recently, the price consolidated near the formation’s lower trendline and 50-day moving average before gapping higher this week. Importantly, above-average volume backed Wednesday’s pop, indicating institutional buying activity behind the move.
Given the stock now trades in blue sky territory, let’s project a potential upside target using the measuring principle and also identify major support levels to monitor during retracements.
Upside Target to Watch
Investors can project an upside target by using the measuring principle, a technique that analyzes well-recognized chart patterns to forecasts future price moves.
When applying the study to Intuitive Surgical’s chart, we calculate the distance of the rising wedge near its widest point and add that amount to the pattern’s top trendline. In this case, we add $70 to $580, which project a target at $650.
Major Support Levels of Interest
During pullbacks , investors should initially keep a close eye on the $550 level. The shares could attract buying interest in this area near the low of Wednesday’s gap, which also aligns with a period of consolidation in November just below the stock’s all-time high (ATH) .
Finally, a close below this region opens the door for a retest of lower support around $520. A retracement to this location could see investors look for entry points near a trendline that links the October peak and December trough.
The comments, opinions, and analyses expressed on Investopedia are for informational purposes only. Read our warranty and liability disclaimer for more info.
As of the date this article was written, the author does not own any of the above securities.
Read the original article on Investopedia

