News
Watch These Salesforce Price Levels as Stock Jumps After Strong Earnings

Key Takeaways
Salesforce shares ( CRM ) jumped in premarket trading Thursday after the enterprise software company reported better-than-expected second-quarter earnings and boosted its full year profit outlook, as customers increased spending on its suite of cloud products.
The San Francisco-based company, which also announced late Thursday that Chief Financial Officer (CFO) Amy Weaver will step down from the role, has seen its shares come under pressure this year amid a slowdown in sales driven by leaner corporate budgets and growing competition in the cloud artificial intelligence (AI) software space.
Salesforce shares were up 4.8% at $271.25 about 90 minutes before the opening bell.
Below, we’ll make sense of what the technicals are saying on the Salesforce chart and point out key price levels that investors will likely be watching following the company’s earnings report.
Breakout From Symmetrical Triangle Pattern
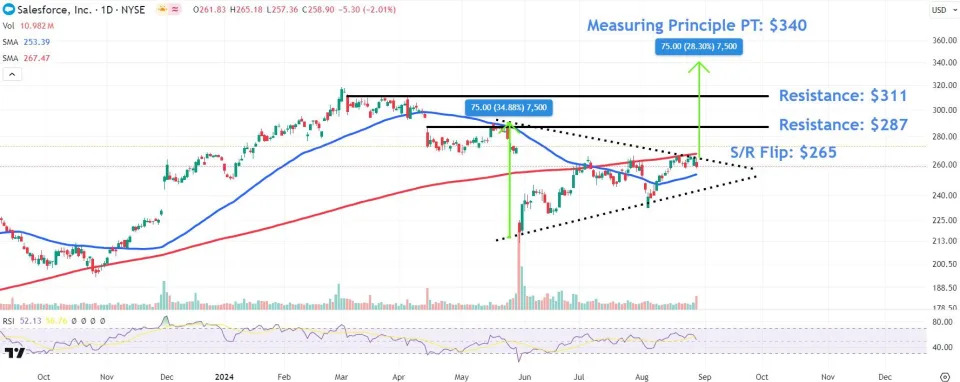
Salesforce shares have oscillated in a symmetrical triangle since mid-May, with a notable stock gap of around 20% occurring early in the pattern. More recently, the price has consolidated just below the triangle’s top trendline and 200-day moving average ahead of the company’s quarterly report.
Thursday’s projected earnings pop positions the stock for a decisive breakout above this closely watched chart area, potentially marking the start of a new trend higher.
Amid the potential for a post-earnings rally, investors should monitor several important price levels on the Salesforce chart.
Monitor These Key Salesforce Chart Levels
The first area to watch sits around $287, a location on the chart that may encounter overhead selling pressure near a trendline that links the April 15 gap day high with a period of week-long consolidation that formed in mid to late May.
Buying above this level could see the share price move up to the $311 area, where sellers could look to offload shares around a range of comparable trading levels throughout March and early April situated just below the stock’s record high .
To forecast a price target above the all-time high (ATH) , we can use the measuring principle . To do this, we calculate the distance of the triangle in points and add that amount to the pattern’s top trendline. In this case, we add $75 (distance between triangle’s two trendlines) and $265 (the pattern’s top trendline), which projects an upside target of $340.
Triangle’s Top Trendline Flips To Support
During retracements , investors should monitor the symmetrical triangle’s top trendline, currently positioned at $265. This location on the chart will likely flip from providing prior resistance into offering future support as it also finds confluence from the nearby upward sloping 200-day MA.
The comments, opinions, and analyses expressed on Investopedia are for informational purposes only. Read our warranty and liability disclaimer for more info.
As of the date this article was written, the author does not own any of the above securities.
Read the original article on Investopedia .

