News
Intermodal is containing the truckload market

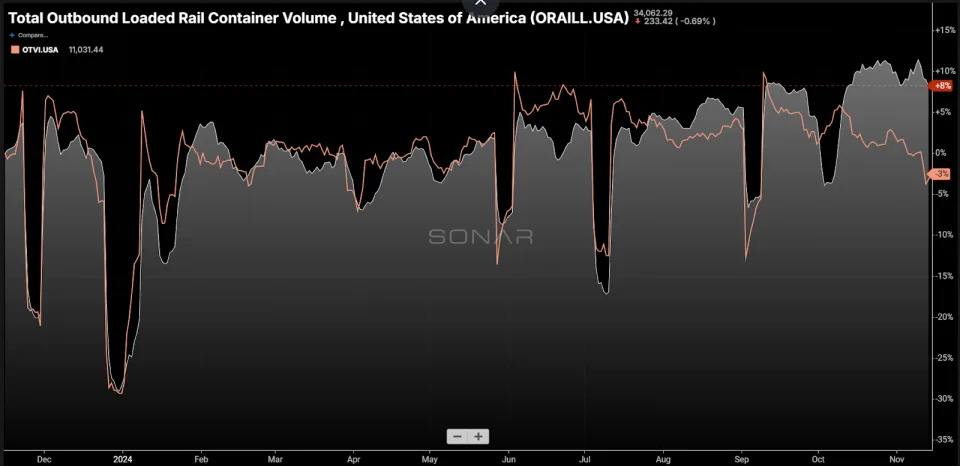
Chart of the Week: Outbound Loaded Rail Container Volumes, Outbound Tender Volume Index – USA SONAR : ORAILL.USA, OTVI.USA
Intermodal demand remains elevated through early November, averaging over 8% higher from an annual perspective. Truckload demand appears to be waning at the same time, with the national Outbound Tender Volume Index (OTVI) showing 3% lower versus this point in 2023. Intermodal demand tends to decline in November as supply chains shift to a more reactive state. Is intermodal keeping a lid on a truckload market breakout?
Supply chains love LA
The largest single lane for intermodal container transportation on the rails is Los Angeles to Chicago, thanks in large part to the volume of international import containers that enter through the ports of Los Angeles and Long Beach.
Transcontinental freight occupies quite a bit of truckload capacity. It takes a solo driver four days to cross the mountains and plains to get to the Windy City and another four on the return trip. A 40- or 53-foot container replaces eight days of truck capacity in this lane.
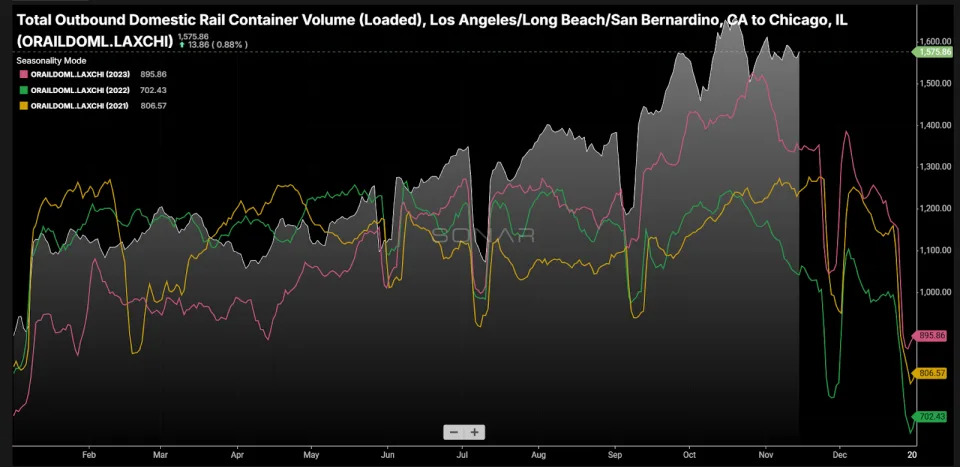
Growth in domestic intermodal containers (sizes 48 or 53 feet) has been significant the past two years. Transloading efficiency has helped drive the viability of this mode of domestic transportation. Volumes are averaging over 25% higher in the Los Angeles to Chicago lane than during the pandemic, replacing an extra 2,200-2,500 truckloads per week over 2021.
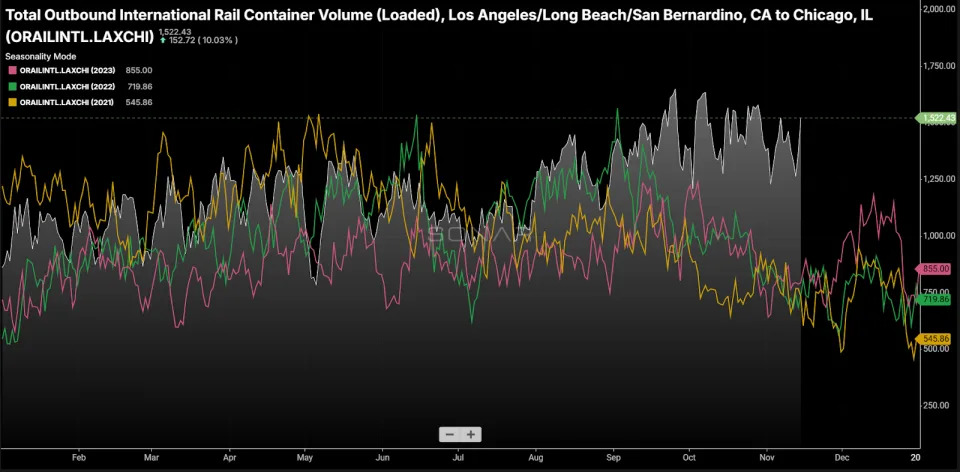
The international container replacement value for trucking in this lane is harder to determine due to the fact that they are 20 feet and 40 feet in length and are mixed together in the data. The low-end estimation would put the replacement value around an additional 1,700 trucks versus the average of the past three years.
Infrastructure limitations and container shortage issues have not been a big issue as of yet, but these problems limited intermodal’s viability in years past. While many people are counting on truckload capacity to exit, they have failed to account for intermodal capacity’s growth as an offset.
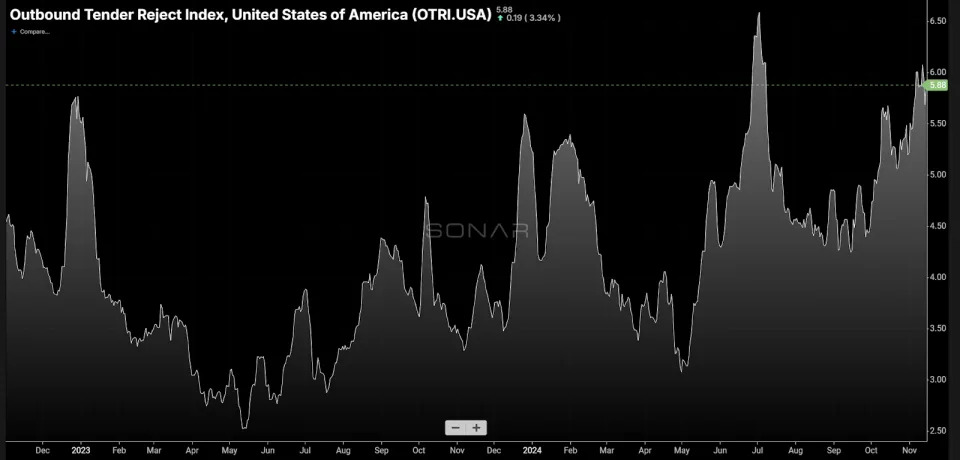
That said, tender rejection rates — the rate at which carriers reject or turn down load coverage requests from customers — for the truckload market hit their second-highest values of the year in early November and are continuing to trend higher despite the declining volumes. Capacity having exited and a shrinking spread between contract and spot rates have helped push carrier compliance consistently lower since May of 2023.
If not for intermodal’s improved viability, the domestic surface transportation market would be much more challenging to navigate. Loaded container volumes are up 14% versus where they were in early November 2021. Truckload tender volumes are down roughly 29% versus the same time.
Considering the intermodal volumes represent a longer length of haul, the gap with the pandemic-era level is not as wide as the percentages may suggest.
Now or later
In the near term, intermodal may seem like it is doing a disservice to many carriers and brokers by muting a potentially strong breakout moment for surface transportation, but this is not necessarily true in the long run.
There are questions around the sustainability of the surge in long-haul freight demand over the past few months. Shipping uncertainty, port strikes and tariff concerns are all contributing factors. The worst thing that could happen for many brokers and carriers is for the market to turn sharply tighter, especially if this demand is seasonal or short-lived.
Surging rates will keep capacity online longer and potentially create a snapback market.
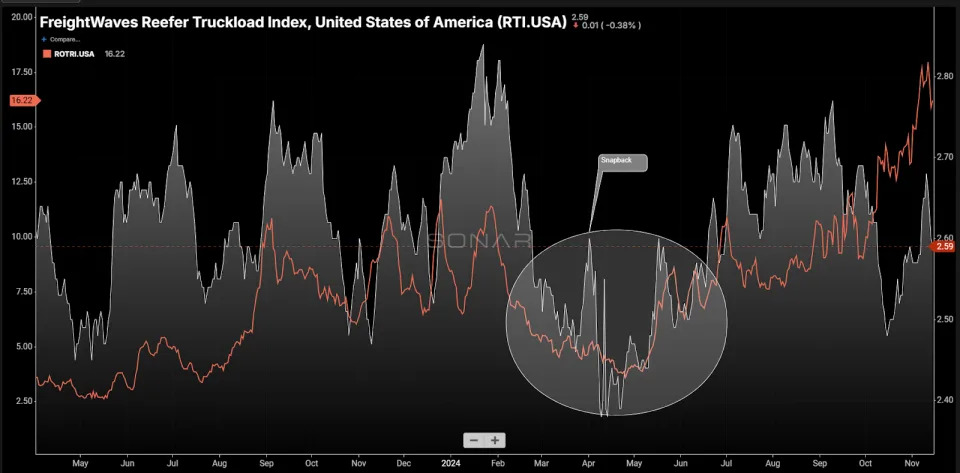
The refrigerated truckload segment seemed to experience a snapback market this past spring after an active fall and winter. Rates increased temporarily then fell back to the post-pandemic lows. The market is still tightening and will continue to do so but at a much healthier and sustainable clip.
About the Chart of the Week
The FreightWaves Chart of the Week is a chart selection from SONAR that provides an interesting data point to describe the state of the freight markets. A chart is chosen from thousands of potential charts on SONAR to help participants visualize the freight market in real time. Each week a Market Expert will post a chart, along with commentary, live on the front page. After that, the Chart of the Week will be archived on FreightWaves.com for future reference.
SONAR aggregates data from hundreds of sources, presenting the data in charts and maps and providing commentary on what freight market experts want to know about the industry in real time.
The FreightWaves data science and product teams are releasing new datasets each week and enhancing the client experience.
To request a SONAR demo, click here .
The post Intermodal is containing the truckload market appeared first on FreightWaves .

