News
This market-timing model nailed the 2022 meltdown. Now it’s warning that stocks are a ‘dead cold sell.’

A little-known market timing indicator with a spot-on track record has just flashed a “dead cold sell” signal.
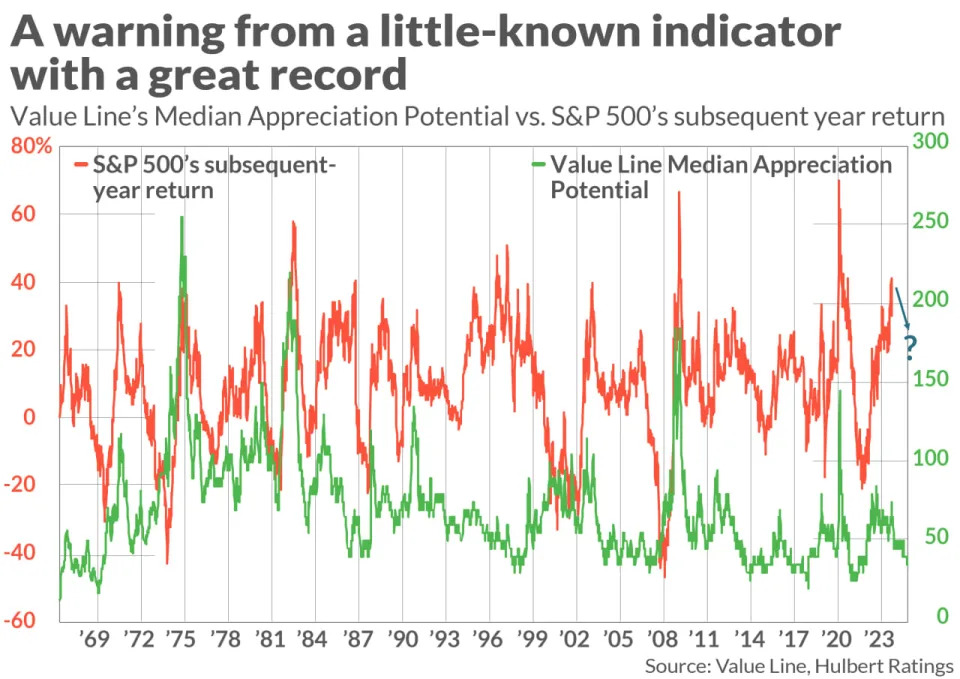
The indicator appears in the Value Line Investment Survey, published weekly by Value Line VALU. It is the median projection from the firm’s analysts of where the 1,700 mid- and large-cap stocks they track will be trading in three to five years. Devotees of this market-timing indicator refer to it as VLMAP, for Value Line’s Median Appreciation Potential.

The “dead cold sell” prediction is attributable to Daniel Seiver, an emeritus economics professor at Miami University (Ohio) who currently teaches economics at California Polytechnic State University in San Luis Obispo, Calif. As far as I can tell, Seiver was one of the first advisers to discover the VLMAP’s market-timing potential.
In addition to recommending the Value Line model in his 1986 book, “Outsmarting Wall Street,” Seiver has been using the model ever since in his investment newsletter, The PAD System Report. (Disclosure: Seiver’s newsletter is not one of the services that pay a flat fee to my performance auditing firm to track their returns.)
For Seiver, A VLMAP reading of 100 is a buy signal. Such a reading corresponds to a projected doubling of stock prices over the subsequent three- to five years.
The last time the VLMAP was that high was in April 2020, following the waterfall-like market decline that accompanied the initial COVID-19 lockdown. (To read the column I wrote about it at the time, click here .) Since then, the S&P 500 SPX has produced a total return of 21.9% annualized — more than twice its historical average.
Now the VLMAP is at the opposite end of the valuation spectrum from April 2020. Its current reading of 35 is a sell-signal in Seiver’s analysis. Though the human tendency is to extrapolate the recent past into the indefinite future, a contrarian approach is the better bet. The last time the VLMAP was as low as it is today was at the market top in late 2021, just prior to the 2022 bear market.
|
|
When VLMAP is <= 35 |
When VLMAP is >= 100 |
|
S&P 500’s return over subsequent 1 year |
4.1% |
14.8% |
|
S&P 500’s annualized return over subsequent 3 years |
4.7% |
10.3% |
|
S&P 500’s annualized return over subsequent 5 years |
4.8% |
10.5% |
The VLMAP’s excellent record over the past five years is consistent with its longer-term performance back to the 1960s, when Value Line first began publishing the model. As you can see from the table above, the VLMAP does an excellent job at both the three- and five-year horizons identifying future periods with higher and lower returns. The table also shows that much of the VLMAP’s accurate record comes from its return in the first year after falling to 35 or rising to 100.
Moreover, the VLMAP’s predictive power did not disappear after Seiver wrote about it in his 1986 book. That’s noteworthy because the all-too-common pattern is for indicators with strong historical records to stop working after they are identified.
Bob Kargenian, President of TABR Capital Management in Orange, Calif., uses the VLMAP to time the market — though he sees a reading of 85 as a buy signal instead of 100 in the case of Seiver. In an email, Kargenian made what he called a “high probability” bet. He wrote: “If you sell now and simply wait until the indicator once again reaches at least 85, you will be buying the SPX much cheaper than today.”
Mark Hulbert is a regular contributor to MarketWatch. His Hulbert Ratings tracks investment newsletters that pay a flat fee to be audited. He can be reached at mark@hulbertratings.com
More: S&P 500 is on a 12-month tear as tariffs threaten 2025 outlook for U.S. stocks
Plus: Sell Treasury bonds or hope for a rebound? Here’s what to do now.

