News
Bitcoin Breaks $100,000 as the Strong Uptrend Continues
$100,000 is a significant milestone for bitcoin which traders had been anticipating for many years. The current uptrend has been most active since the American presidential elections, with Donald Trump’s clear win driving expectations of a crypto-friendly government. This article summarises recent on-chain data then looks briefly at the charts of BTCUSD and ETHUSD .
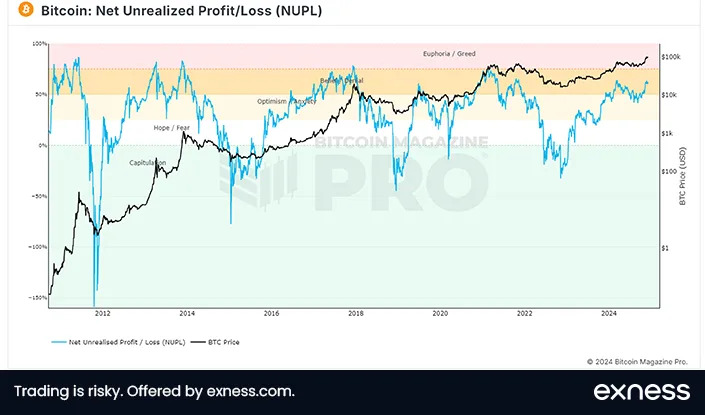
Bitcoin’s gains came amid a general bull run and euphoria in crypto markets, but sentiment still doesn’t seem to have reached a peak:

Net unrealised profit and loss (‘NUPL’) is now around 62%, so in the area of belief. Historically, the most favourable time for medium-term investors to take profits was at the top, above 80% NUPL, so there still seems to be some room for the price to rise. However, as NUPL rises, traders should be aware that a sharp correction becomes more likely.
Realised prices show that this is not an ideal time to buy more: the long-term realised price is now around $25,000, only about a quarter of the actual price, while the short-term figure is about $78,000. These numbers indicate the possibility of profit-taking by investors and traders who have significant unrealised profits.
Meanwhile only about 0.25% of all addresses are in loss. Overall, there’s no immediate indication of a retreat by the price back below $100,000, so sentiment and to a lesser extent monetary policy and major data such as next week’s American inflation are the main factors to watch.
Further Continuation Seems Possible for Bitcoin

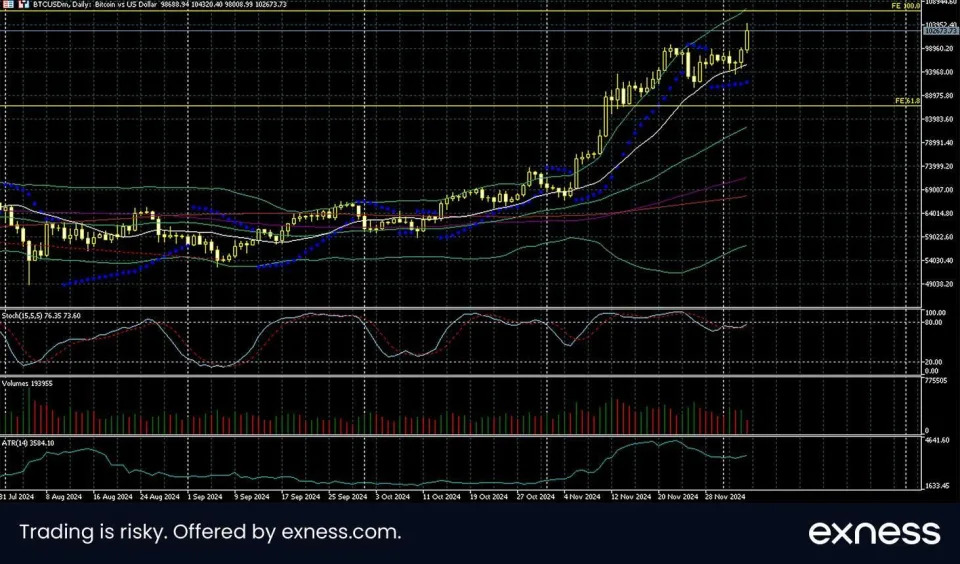
Bitcoin surged past $100,000 on 5 December in a large intraday movement as sentiment continued to be positive. Participants expect a significantly more crypto-friendly environment when the new American government takes charge in January.
Based on performance within the last month, it’s unlikely that $100,000 will now become a strict level of support, rather an area. It’d be possible to see the price retreating below there before another move up. The next likely resistance is the 100% monthly Fibonacci expansion around $107,000.
With the price not currently overbought based on the slow stochastic or Bollinger Bands, the trend looks likely to continue now that upward momentum seems to have returned in strength. Traders’ main challenge remains finding suitable places for stops between premature triggering and exposure to a possibly large correction if sentiment shifts.
Ether Follows Bitcoin Up; $4,000 in View

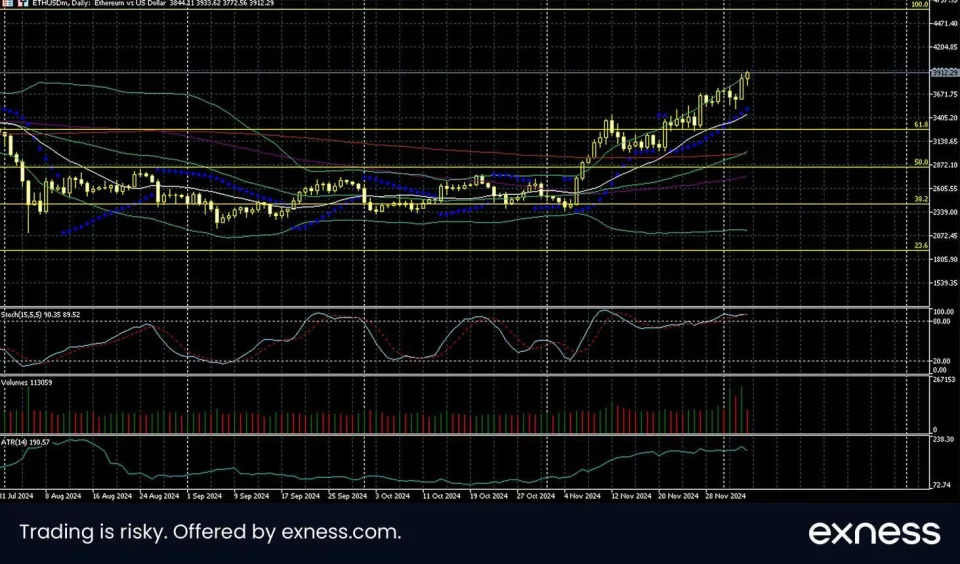
Like most major altcoins, Ether has followed bitcoin’s recent gains amid strongly positive sentiment and new inflows of capital. Unlike bitcoin, though, Ether still hasn’t made a new all-time high during this bull run. The price is still about 20% below November 2021’s high around $4,850.
Although $4,000 is the clear immediate target and it seems likely that the price will reach there soon, it’s questionable whether it’ll continue further or hold above there for long. That area was tested unsuccessfully twice in the first half of the year. However, the context of an aggressively bullish market means that overbought signals can probably be discounted and it’s clear that volume supports the trend, with buying having spiked recently.
The 61.8% monthly Fibonacci retracement around $3,270 seems to be the main area of static support, but this is obviously quite far below the current price The 20 SMA could be an important dynamic support. Neither the NFP nor next week’s American inflation are likely to have a lasting impact on the direction unless they’re notably surprising but short-term volatility will probably increase around these releases.
This article was submitted by Michael Stark, an analyst at Exness Exness .
The opinions in this article are personal to the writer. They do not reflect those of Exness or FX Empire.
This article was originally posted on FX Empire

