News
Watch These MicroStrategy Levels as Bitcoin Hits Record, Stock Added to Nasdaq 100

Key Takeaways
MicroStrategy ( MSTR ) shares rose in premarket trading Monday after Bitcoin ( BTCUSD ) set a new record high above $106,000 and the company's stock secured inclusion in the Nasdaq 100 index.
The Bitcoin proxy, which began purchasing the legacy cryptocurrency in August 2020 to diversify its corporate assets, has seen its shares surge more than six-fold since the start of the year through Friday’s close as Bitcoin's price continues to make new highs.
Sentiment may also receive a boost after the Nasdaq announced late on Friday that the company’s stock will join the Nasdaq 100, meaning large index-tracking exchange-traded funds (ETFs) , such as the Invesco QQQ Trust ( QQQ ), will become automatic buyers of the stock.
The stock was up nearly 4% at $424 in recent pre-market trading.
Below, we take a closer look at MicroStrategy’s chart and use technical analysis to identify important price levels that investors may be watching.
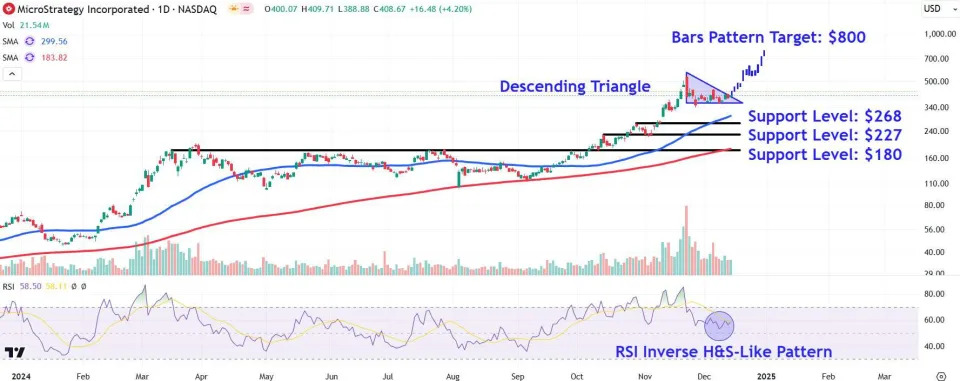
Descending Triangle Takes Shape
Since a bearish engulfing pattern marked a record high in MicroStrategy shares last month, they have consolidated within a descending triangle , a chart pattern that often signals a move in the direction of a breakout or breakdown .
Meanwhile, the relative strength index (RSI) has retreated below overbought levels throughout the stock’s latest consolidation phase, though it has carved out an inverse head and shoulders -like pattern, potentially pointing to a local bottom in the indicator.
Let’s turn to MicroStrategy’s chart to forecast a potential breakout target worth watching and also identify several important support levels to monitor upon a possible breakdown.
Breakout Target to Watch
Investors can forecast a potential breakout target using the bars pattern tool, a technique that analyzes prior trends to predict future price moves.
To apply the tool to MicroStrategy’s chart, we extract the recent trend higher that preceded the descending triangle and reposition it from the pattern’s upper trendline , forecasting that an upside continuation move may play out in the stock. This projects a target of around $800, nearly double Friday’s $408.67 closing price, an area where investors could look to take profits .
Breakdown Support Levels to Monitor
Upon a breakdown from the descending triangle, investors should initially monitor the $268 level. This location, currently just below the 50-day moving average (MA) , could encounter support around the October swing high .
A close below this level could see the shares fall to around $227, a region on the chart where investors may seek entry points near the mid-October peak and early-November trough.
Finally, MicroStrategy bulls’ inability to defend this area opens the door to a retest of lower support at the $180 level. Investors could look for buying opportunities in this location near the 200-day MA and a multi-month horizontal line that connects a range of comparable price action between March and October.
The comments, opinions, and analyses expressed on Investopedia are for informational purposes only. Read our warranty and liability disclaimer for more info.
As of the date this article was written, the author does not own any of the above securities.
Read the original article on Investopedia

