News
Palantir’s high valuation paints a stark picture of the S&P 500’s priciest picks

You have probably seen warnings that after two years of double-digit gains for the S&P 500, stocks are getting pricey. Then again, you find warnings that the sky is about to fall down every day in the financial media.
It turns out that if you take a harder look at the most expensive stocks, there are big differences in the companies’ expected financial performance. Understanding those differences can help you make money or avoid big losses when playing individual stocks.
Memories tend to be short. So far this year, the S&P 500 SPX has returned 29.1%, with dividends reinvested. That has followed a return of 26.3% last year. So far so good. But did you forget that the S&P 500 fell 18.1% in 2022? All together, this means the U.S. large-cap benchmark stock index has returned “only” 33.5% since the end of 2021. That’s actually pretty good — the index’s three-year average return of 10.88% compares with a 30-year average return of 11.05%, according to FactSet.
Stretching our horizon a bit, the S&P 500 has returned 106% for five years — it has more than doubled, despite the Covid-19 disruption in 2020, a brief recession and then a difficult interest-rate cycle as the Federal Reserve made moves to clamp down on inflation.
So what about this expensive market? The forward price-to-earnings ratio for the S&P 500 is 22.4. That forward P/E is a weighted calculation of the index’s price divided by consensus estimates for the next 12 months for component companies among analysts polled by FactSet. The index’s average forward P/E has been 20 over the past five years, peaking at 23.6 in August 2020.
But to screen individual stocks to see which ones are “most expensive,” we have looked at forward price-to-sales ratios. This is because there is no P/E ratio for an unprofitable company. A company might be posting a 12-month net loss because of a noncash accounting adjustment. Or a company might be going through a period of relatively low profitability that distorts its P/E ratio.
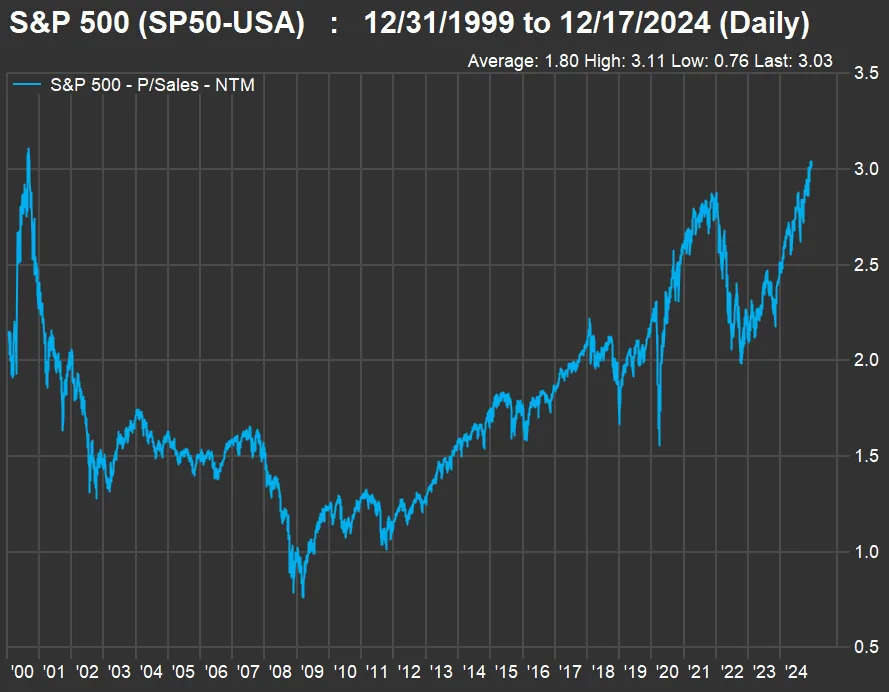
On the same rolling 12-month basis, here is how the S&P 500’s forward price-to-sales ratio has moved since the end of 1999:

For this period, the index’s forward price/sales valuation peaked at 3.1 in September 2000. The level was 3.0 at Monday’s close. The index’s average forward price/sales ratio for the past five years has been 2.5.
Screening the S&P 500 by forward price/sales ratios
These 20 companies in the S&P 500 have the highest forward price/sales ratios, based on Monday’s closing prices and consensus estimates among analysts polled by FactSet:
|
Company |
Ticker |
Forward price/ sales |
Forward price/ sales one year ago |
Current price/sales to 3-year average |
Current price/sales to 5-year average |
|
Palantir Technologies Inc. |
PLTR |
49.5 |
15.1 |
338% |
N/A |
|
Fair Isaac Corp. |
FICO |
25.5 |
16.1 |
187% |
214% |
|
CrowdStrike Holdings Inc. Class A |
CRWD |
20.5 |
16.4 |
137% |
100% |
|
Intuitive Surgical Inc. |
ISRG |
20.4 |
14.2 |
137% |
130% |
|
Axon Enterprise Inc. |
AXON |
19.5 |
10.3 |
200% |
196% |
|
Broadcom Inc. |
AVGO |
18.7 |
10.7 |
204% |
237% |
|
Arista Networks Inc. |
ANET |
17.8 |
11.2 |
171% |
189% |
|
ServiceNow Inc. |
NOW |
17.7 |
13.3 |
144% |
127% |
|
Nvidia Corp. |
NVDA |
17.1 |
13.8 |
99% |
100% |
|
Cadence Design Systems Inc. |
CDNS |
16.5 |
16.2 |
116% |
125% |
|
Blackstone Inc. |
BX |
15.8 |
11.8 |
157% |
152% |
|
MSCI Inc. |
MSCI |
15.6 |
15.1 |
101% |
94% |
|
Mastercard Inc. |
MA |
15.5 |
14.0 |
110% |
101% |
|
Visa Inc. Class A |
V |
15.4 |
14.1 |
110% |
101% |
|
KKR & Co. Inc. |
KKR |
14.5 |
9.4 |
186% |
207% |
|
CME Group Inc. Class A |
CME |
13.5 |
12.9 |
102% |
100% |
|
Verisk Analytics Inc. |
VRSK |
12.9 |
11.9 |
115% |
120% |
|
Tesla Inc. |
TSLA |
12.8 |
6.9 |
182% |
158% |
|
Eli Lilly and Co. |
LLY |
12.7 |
14.0 |
100% |
124% |
|
Prologis Inc. |
PLD |
12.5 |
16.4 |
72% |
68% |
Palantir Technologies PLTR went public in September 2020. It has the highest forward price/sales ratio for any company in the S&P 500. Among the 20 companies listed here, Palantir’s forward price/sales ratio is also highest relative to its three-year average valuation.
In comparison, Nvidia Corp.’s NVDA forward price/sales ratio is 17.1, which is in line with its three-year and five-year valuations.
But the valuations alone don’t tell enough of a story.
Let’s look at expected compound annual growth rates (CAGR) revenue from 2024 through 2026 for this same group of companies. These growth projections are based on consensus calendar-year estimates as adjusted by FactSet for companies whose fiscal years don’t match the calendar.
|
Company |
Ticker |
Two-year expected revenue CAGR through 2026 |
Estimated 2026 sales ($mil) |
Estimated 2025 sales ($mil) |
Estimated 2024 sales ($mil) |
|
Palantir Technologies Inc. |
PLTR |
22.6% |
$4,224 |
$3,513 |
$2,809 |
|
Fair Isaac Corp. |
FICO |
15.5% |
$2,390 |
$2,083 |
$1,792 |
|
CrowdStrike Holdings Inc. Class A |
CRWD |
21.7% |
$5,707 |
$4,685 |
$3,855 |
|
Intuitive Surgical Inc. |
ISRG |
16.3% |
$11,013 |
$9,524 |
$8,149 |
|
Axon Enterprise Inc. |
AXON |
22.1% |
$3,096 |
$2,559 |
$2,076 |
|
Broadcom Inc. |
AVGO |
16.1% |
$71,749 |
$62,772 |
$53,214 |
|
Arista Networks Inc. |
ANET |
18.5% |
$9,788 |
$8,297 |
$6,967 |
|
ServiceNow Inc. |
NOW |
20.5% |
$15,951 |
$13,247 |
$10,989 |
|
Nvidia Corp. |
NVDA |
38.0% |
$235,077 |
$191,484 |
$123,366 |
|
Cadence Design Systems Inc. |
CDNS |
12.4% |
$5,855 |
$5,247 |
$4,634 |
|
Blackstone Inc. |
BX |
23.0% |
$17,050 |
$14,589 |
$11,272 |
|
MSCI Inc. |
MSCI |
9.4% |
$3,421 |
$3,125 |
$2,859 |
|
Mastercard Inc. |
MA |
12.1% |
$35,282 |
$31,507 |
$28,087 |
|
Visa Inc. Class A |
V |
9.8% |
$44,424 |
$40,377 |
$36,820 |
|
KKR & Co. Inc. |
KKR |
26.9% |
$11,632 |
$9,658 |
$7,222 |
|
CME Group Inc. Class A |
CME |
3.5% |
$6,568 |
$6,297 |
$6,131 |
|
Verisk Analytics Inc. |
VRSK |
7.3% |
$3,314 |
$3,092 |
$2,880 |
|
Tesla Inc. |
TSLA |
18.5% |
$140,026 |
$117,157 |
$99,746 |
|
Eli Lilly and Co. |
LLY |
24.0% |
$70,090 |
$58,546 |
$45,571 |
|
Prologis Inc. |
PLD |
8.5% |
$8,944 |
$8,262 |
$7,592 |
Most of these projected revenue growth rates are impressive. The full S&P 500 is expected to increase revenue at a weighted CAGR of 5.9% through 2026.
Palantir and Nvidia make for an interesting comparison. Palantir’s forward price/sales ratio is more than twice as high as Nvidia’s. But Nvidia’s two-year projected revenue CAGR of 38% is the highest on the list, and much higher than Palantir’s projected revenue CAGR of 22.6%.
Related coverage:
Click the tickers for more about each company.
Read: Tomi Kilgore’s guide to the wealth of information available for free on the MarketWatch quote page
Don’t miss: Four hidden gems in the stock market from a five-star fund manager

