News
Monitor These Nvidia Stock Price Levels After Two Years of Massive Gains

Key Takeaways
Shares in artificial intelligence (AI) chipmaker Nvidia ( NVDA ) will be in the spotlight ahead of a presentation by CEO Jensen Huang scheduled for next Monday at the Consumer Electronics Show in Las Vegas.
Investors will be watching for updates from Huang on sales projections for the company’s Blackwell chips and details about Rubin, Blackwell's successor, which Nvidia plans to release in 2026. Several leading Wall Street firms have named the AI behemoth as their 2025 “ top pick ,” pointing out that strong demand for its Blackwell platform positions the company for another year of explosive growth.
Nvidia shares closed out 2024 with a gain of 170% amid surging demand for its silicon as big tech customers—including Microsoft ( MSFT ), Meta ( META ) and Alphabet’s ( GOOGL ) Google—beefed up their AI datacenter and cloud computing infrastructure. Last year's big gain came on the heels of a 240% increase in 2023.
Below, we take a closer look at Nvidia’s chart and use technical analysis to identify key price levels to watch out for in early January .
Descending Channel Takes Shape
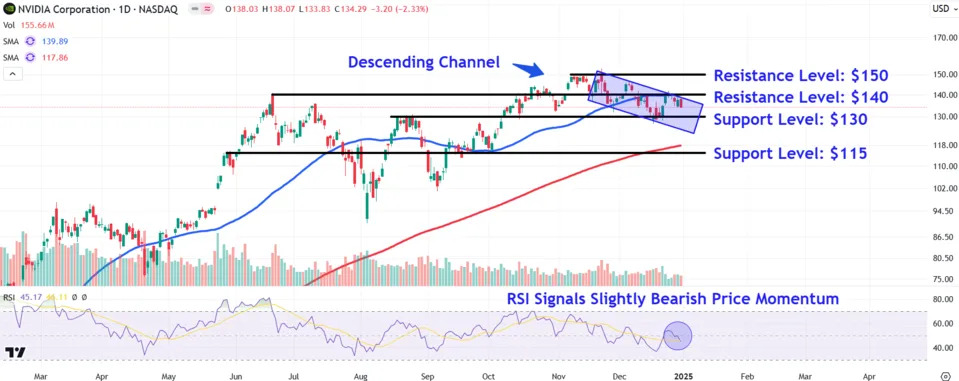
After setting their record high in late November, Nvidia shares have traded within a descending channel , with the price tagging the pattern’s upper and lower trendlines on several occasions since that time.
More recently, the stock ran into selling pressure near the channel’s top trendline and 50-day moving average (MA) , though the move occurred on light end-of-year share turnover.
The relative strength index (RSI) signals slightly bearish price momentum in the stock to kick off 2025 with the indicator falling below 50.
Let’s look at key support and resistance levels on Nvidia’s chart that investors may be eyeing as the first quarter gets underway.
Key Support Levels to Watch
The first level to watch sits around $130, a location on the chart where the shares may encounter support near a trendline that connects the prominent August swing high with the December swing low .
A decisive close below this important technical level could see the shares break down beneath the descending channel’s lower trendline and revisit lower support around $115. This location, currently just below the rising 200-day MA , would likely attract buying interest near a horizontal line that links a range of comparable price points between May and October last year.
Important Resistance Levels to Monitor
Upon a move higher from current levels, investors should initially monitor the $140 area. The shares may run into resistance in this region near the descending channel's upper trendline, which also closely aligns with the stock’s June 2024 peak .
Buying above this level could see the shares rally up to around $150. Investors who have bought the recent retracement may seek to lock in profits in this area near a series of price action situated just below the stock’s record high.
The comments, opinions, and analyses expressed on Investopedia are for informational purposes only. Read our warranty and liability disclaimer for more info.
As of the date this article was written, the author does not own any of the above securities.
Read the original article on Investopedia

